

If you’ve come here looking for how to use Linkr.bio Google analytics, you probably already know that the statistics of your “link in bio” is crucial when it comes to social marketing.
Linkr.bio allows you to make the most of your link bio site by integrating Google analytics. For a fact, it helps you to understand the best contents that work for your audience.
So now, log in to your Linkr.bio account, and you will see at the top a tab showing your Statistics. Keep reading, we’ll walk you through how to use your Linkr.bio Statistics, whether you’re using Free version or the extended Analytics that come with PRO.
View Statistics with Free — Lifetime Analytics
This section shows your total Views, Clicks, Click Through Rate, and Time to Click for the lifetime of your account. That is, from the very start of your Linkr until today. This gives you an overall analysis of your Linkr.bio page and it is available to both free and pro users.
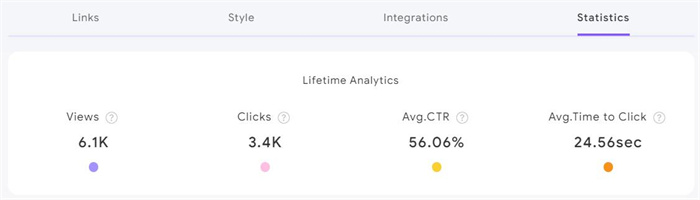
Views – It shows how many times your bio link has been viewed since it’s been created. If a visitor lands on your Linkr.bio page once, that will increase 1 view. If the person views your page multiple times, that is counted as multiple times. A person can view your pages many times and that will add up your total views.
Clicks – It shows the amount of clicks across all your links on the landing page. For example, if a visitor clicks on your 3 different links, that is counted as 3 clicks.
Avg. CTR – CTR stands for Click Through Rate. It is a way to measure the performance of your links, by telling you the percentage of views that result in a clicked link. If your CTR is 52%, then 52% of your views result in a click of one of your links.
Avg. Time to Click – Your Time to Click is the average time it takes for your audience to land on your Linkr.bio profile and then click on one of your links on the landing page.
Advanced Analytics with PRO — Data Dashboard
With Linkr.bio PRO plan, you get an extra layer of insight into how your link in bio is performing. The data dashboard is only available to Pro users. >> Get to know all Benefits of Linkr.bio Pro plan
Activity
This section gives you visual insights on your Views, Clicks, CTR and Avg. Time to Click. By clicking on the top left corner of the chart, you can change the time interval for your daily, weekly, and monthly analysis. You are also able to click on the data in the chart so you can view statistics for each date.

Custom Date Range – Our date range selector allows you to choose any range of dates so that you can analyze your bio link performance around for a specific period of time, be it this week or last year.
Unique Views – A unique view is how many different times your Linkr.bio URL has been clicked within your date range. For example, if 1 visitor lands on your Linkr.bio page once, that is counted as 1 view. If that visitor visits your Linkr.bio page another 3 times from the same device, it would still count as 1 unique view.
Unique clicks – A unique click shows how many individual visitors have clicked on one or more of your links stored on the landing page within the date range. For example, if 1 visitor clicks on 3 different links, your unique clicks count will increase by 1.
Links
Here you can see the lifetime performance of each individual link on your Linkr.bio page, along with the clicks and CTR. With the traffic analytics, you can measure which links are the most popular among your visitors.
Icons
If you’ve added social icons to your Linkr.bio page, here you can see what social media accounts your visitors have exactly viewed and clicked. Similar to ‘links’, you can click on the top left corner of the chart for different analytical purposes.
Top Locations
This block shows your total Views, Clicks, Click Through Rate, and Time to Click, per country for the date range selected. The location is based on the country and city your visitor was in when they visited your link in bio.
Top Referrers
This block shows your total Views and Time to Click from each referrer. A referrer is where your visitor came from before landing on your Linkr.bio site.
Device Analytics
This block shows your total Views, Clicks, Click Through Rate, and Time to Click, per device for the date range selected.
Why you should use Linkr.bio analytics
Linkr.bio is used by over 1 million individuals across 50+ countries with proven results for business — largely due to the powerful and accurate Linkr.bio statistics.
The decision to use Linkr.bio analytics seems very easy to made. Here are the reasons:
- Linkr.bio trace all possible touch points and receive all the trace data.
- Understand insights from your bio link at one glance.
- Gain access to in-depth statistics for views, clicks, Click Through Rate from different locations, social icons, referrers, and device.
- See what’s your audiences’ favorite link in bio, social channel, and device.
- Understand where you audience/customers are.
- And finally, leverage the collected trace data to make wiser decisions for your business: re-marketing, increasing conversations, and optimizing campaigns.
So, that’s it! You now have a better understanding of how Linkr.bio Analytics works, and why you should use it for boosting your business and building your social presence. Once you set up your Linkr.bio page, you can see data roll in.
Keep reading:
15 Comments
Rene
ok
dylan
espero que les guste este sitio
Alice Wang
Hi, thanks for your support. We will keep going and delivering the best If there is anything we can do for you, please click here to join Linkr users community, and get support replies ASAP.to get support replies ASAP!
Everett
I blog frequently and I genuinely thank you for your content.
The article has really peaked my interest. I’m going to bookmark
your website and keep checking for new information about
once a week. I opted in for your Feed too.
Alice Wang
Thanks for your encouraging works, we will keep posting more articles for how to make most of Linkr.bio features for your bio link.
Aurora
Hmm is anyone else experiencing problems with the images on this blog loading?
I’m trying to determine if its a problem on my end or if it’s the blog.
Any suggestions would be greatly appreciated.
Alice Wang
Hi Aurora, sorry for the trouble, we have updated the images, so that you can better understand how to use Linkr.bio analytics, can you see now?
Margart
Thanks in favor of sharing such a good thinking, piece
of writing is nice, thats why i have read it completely
Alice Wang
Thanks a lot for your positive review. Please keep using Linkr.bio and the analytics for you bio link. Don’t hesitate to reach out to hello@linkr.bio. Or an easier way, click linkr.bio to join Linkr users community, and get support replies ASAP.
Supamas naksuwan
ฉันอยากสมัครสนใจรูปภาพแบบสวย

Alice Wang
Please set up Linkr.bio, and find free and pro themes in the style. And if you are pro users, you can upload your own picture or videos for the background of your link in bio landing page. Please using Linkr.bio and make most of the Linkr.bio analytics
Dominic
Thank you for some other wonderful article. The place else
may just anyone get that type of info in such a perfect approach of writing?
I’ve a presentation subsequent week, and I am on the search
for such information.
Alice Wang
Thanks for your comment. We’ll keep writing blogs and articles about how to use link in bio tool effectively for business and making social presence. Please stay tuned!
Nujumudeen Sali
Thank you linkr
Alice Wang
Hi Nujumudeen Sali, you are most welcome! Thanks for your love! Please let us know if you have any suggestions for Linkr.bio Google analytics, or for your bio link.